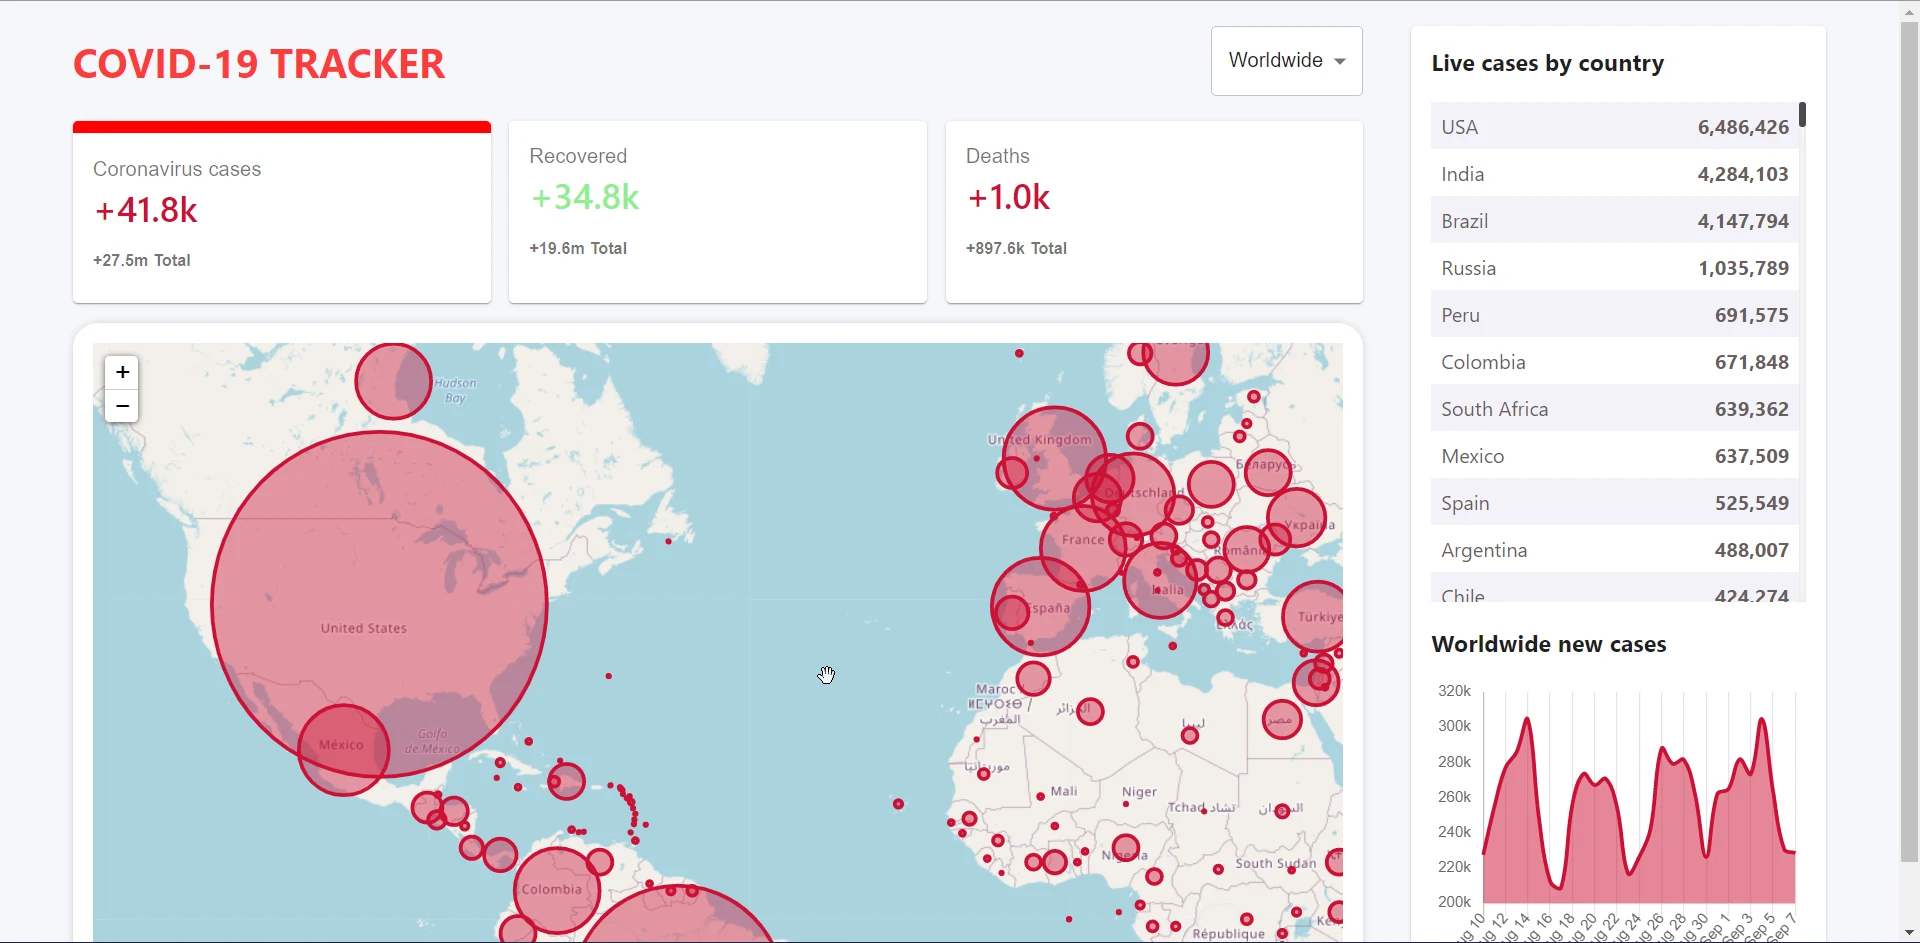
A dashboard for Covid-19 data. Pick a country, or stay on worldwide, and every panel updates.
What it does
- Totals for cases, recoveries and deaths, worldwide or per country
- A Leaflet world map with circles sized by case count
- A Chart.js line graph of new cases over time
- A table of countries sorted by number of cases
How it’s built
React, Material UI, Leaflet and Chart.js, with data from the open disease.sh API.